
Rough Thesis
DCF coverage on Lovisa Holdings (ASX: LOV) with a 12-month price target of $27.65, implying about 11.9% upside from the current share price of $24.71. Rating: Buy.
Lovisa is a fast-fashion jewellery and accessories retailer, rolling out small-format stores globally on a high-turnover, low-price model. It had 1,095 stores across 50+ markets as of December 2025, and runs 82%+ gross margins that fund its own international expansion without needing external capital.
Growth is accelerating, not slowing. FY25 revenue grew 14.2%, and H1 FY26 jumped to 23.3%. It is now clearly international-led: Europe and the Americas grew 37-39% in H1 FY26, offsetting a mature Australian home market that has already turned negative (-4.9% in the same half). Lovisa is also investing in Jewells, a new second brand still in its loss-making start-up phase (-$10.8m EBIT in H1 FY26), but a real option on a second growth engine if it scales the way the core brand did. Founder and Chairman Brett Blundy, who holds 39% of the register, made his first on-market share purchase in over a decade in March 2026, a genuine insider conviction signal, not routine dealing.
Key risks
- Jewells drag. The size and duration are uncertain, with no guarantee of a path to profitability.
- Australia has already gone negative. There is no offset if international growth decelerates faster than modelled.
- Volatility. The stock sits well below its 52-week high of $43.68.
- Discretionary and FX exposure. Fast fashion is exposed to consumer spending, and FX exposure grows as the US and Europe mix increases.
- Terminal value. Around 74.9% of the DCF's enterprise value sits in the terminal value, so the result is sensitive to long-run growth and discount rate assumptions.
Try The Model
Drag the sliders to change the assumptions. It starts at the base case, A$27.65.
Sensitivity
Value per share across discount rates and terminal growth. Dark cells are above today's price of A$24.71. Click a cell to jump to it.
Forecast
FY22A–FY25A come from Lovisa's annual reports and the forecast follows the assumptions below. It updates with the sliders. Historical free cash flow excludes working capital.
Assumptions Explained
Each input, with its source and reasoning.
Built using the Capital Asset Pricing Model (CAPM) for cost of equity, blended with after-tax cost of debt.
| Input | Value | Basis |
|---|---|---|
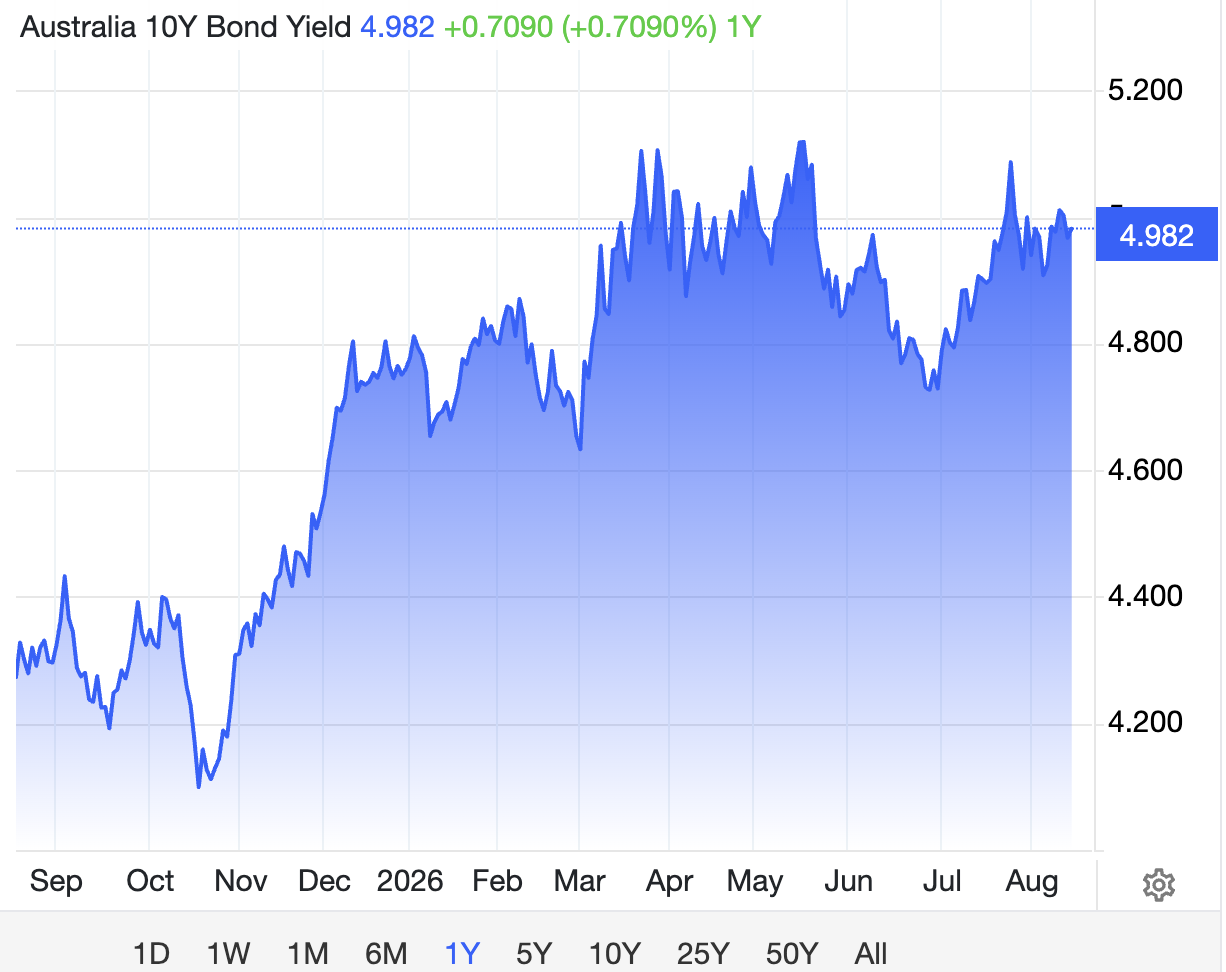
| Risk-free rate | 5.0% | Australian 10-year government bond yield (Trading Economics) |
| Equity risk premium | 5.5% | Standard long-run market convention for Australia |
| Beta (5-year) | 1.14 | StockAnalysis.com |
| Cost of equity | 11.27% | 5.0% + (1.14 x 5.5%) |
| Cost of debt (pre-tax)* | 5.0% | Assumption, explained below |
| Tax rate | 26% | 2-year average effective tax rate |
| Cost of debt (after-tax) | 3.70% | 5.0% x (1 - 26%) |
| Weight of equity | 87.0% | Market cap / total capital |
| Weight of debt | 13.0% | Net debt / total capital |
| WACC | 10.3% | (87.0% x 11.27%) + (13.0% x 3.70%) |
*How the cost of debt was backed out
Cost of debt is finance cost divided by average debt balance for each period, then averaged to arrive at the assumption used in WACC.
FY25 (full year)
| Item | Value | Source |
|---|---|---|
| Finance costs, FY25 | $20.960m | FY25 Annual Report, income statement |
| Debt, FY24 year-end (borrowings + leases) | $359.067m | FY25 Annual Report, balance sheet (comparative) |
| Debt, FY25 year-end (borrowings + leases) | $499.643m | FY25 Annual Report, balance sheet |
| Average debt balance | $429.355m | Average of FY24 and FY25 year-end |
| Implied cost of debt | 4.88% | $20.960m / $429.355m |
1H FY26 (annualised)
| Item | Value | Source |
|---|---|---|
| Finance costs, 1H FY26 (26 weeks to 28-Dec-25) | $12.626m | H1 FY26 Interim Report, income statement |
| Finance costs, annualised (x2) | $25.252m | 1H FY26 finance costs x 2 |
| Debt, FY25 year-end | $499.643m | FY25 Annual Report, balance sheet |
| Debt, 28-Dec-25 | $481.236m | H1 FY26 Interim Report, balance sheet |
| Average debt balance | $490.440m | Average of FY25 year-end and 28-Dec-25 |
| Implied cost of debt (annualised) | 5.15% | $25.252m / $490.440m |
Averaging the two: (4.88% + 5.15%) ÷ 2 = 5.02%, rounded to 5.0%, the pre-tax cost of debt used in the WACC calculation. It is a blended rate of real cash interest and non-cash AASB16 lease interest.
Method: Gordon Growth (perpetuity growth) model, P = D1 ÷ (r − g). Here the terminal value is the FY30E free cash flow grown one year at g, divided by WACC less g, then discounted back from year 5.
| Input | Value |
|---|---|
| Terminal growth rate | 3.0%* |
| Discount rate applied | 10.3% (WACC) |
| Discounting convention | Year 5 |
*Terminal growth of 3.0% is standard convention, not freshly sourced. It is capped near the RBA's 2-3% inflation target, since growth cannot outpace the economy forever.
The 2-year average effective tax rate, calculated from Lovisa's own audited accounts.
- FY24: 25.48% = tax expense $28.181m ÷ profit before tax $110.592m
- FY25: 26.95% = tax expense $31.852m ÷ profit before tax $118.184m
Average: (25.48% + 26.95%) ÷ 2 = 26.215%, rounded to 26%.
| Year | Growth |
|---|---|
| FY26E | 21.7% |
| FY27E | 16.0% |
| FY28E | 13.0% |
| FY29E | 11.0% |
| FY30E | 9.0% |
FY26E takes the average of 1H FY26 revenue of $500.651m (+23.3% YoY) and 2H26E of about $470.6m (the 2H25 base of $392.2m grown about 20%, toned down from the trading update's 21.5%).
From the H1 FY26 Half Year Results Announcement: "Trading for the first 7 weeks of the second half saw total sales for this period up 21.5% on the same period in FY25, with comparable store sales up 1.6%."
So: (23.3% + 20%) ÷ 2 = 21.7%.
FY27E to FY30E decline toward the 3.0% terminal growth rate as the store rollout matures and comparisons get harder. This is a standard glide-path convention, not company guidance.
| Year | EBIT margin |
|---|---|
| FY26E | 17.0% |
| FY27E | 17.6% |
| FY28E | 18.2% |
| FY29E | 18.7% |
| FY30E | 19.2% |
- FY26E held at 17.0%, roughly flat against FY25's 17.4%, adjusted down for the Jewells drag revealed in the H1 FY26 result. From the H1 FY26 Interim Report: "...which contributed an EBIT loss of $10.8m for the period (1H FY25: $0.3m loss)". This is a judgement call, not mechanically calculated: FY25 margin (17.4%) less an estimated ongoing Jewells drag is about 17.0%.
- FY27E to FY30E recover toward 19.2% as the Jewells drag shrinks as a share of a growing revenue base, and the core Lovisa Stores business (already at 21.9% margin excluding Jewells in 1H26) continues its underlying trend. The pace of roughly 50-60bps a year is an assumption, not sourced or company guidance.
Jewells drag, explained. Jewells is Lovisa's new second jewellery brand, just launching (UK-only so far), a small separate business alongside the main Lovisa stores. It is new and still losing money, which drags down Lovisa's overall profit.
| Year | D&A, % of revenue |
|---|---|
| FY22A | 13.0% |
| FY23A | 12.4% |
| FY24A | 13.3% |
| FY25A | 13.6% |
| FY26E–FY30E | 13.0% |
Set at roughly the midpoint of this audited FY22-FY25 range and held flat across all five forecast years. It is not derived from a forward-looking driver such as planned capex or useful life schedules, just a historical average carried forward.
| Year | Capex, % of revenue |
|---|---|
| FY22A | 8.1% |
| FY23A | 12.9% |
| FY24A | 5.5% |
| FY25A | 7.6% |
| FY26E–FY30E | 7.5% |
7.5% reflects the typical, more normal years: FY22 (8.1%), FY24 (5.5%) and FY25 (7.6%) average out to around that level. FY23 (12.9%) was unusually high, a one-off heavy year of new-store building, so it is set aside rather than pulling the estimate up.
| Year | Increase in NWC, % of revenue growth |
|---|---|
| FY26E–FY30E | 2.0% |
2% was chosen as a small, conservative buffer, enough to reflect some working capital drag from growth without assuming a specific inventory or payables trend that is not reliably backed by the historical data.
References
- 1. Lovisa Holdings Limited. (2023). Preliminary final report for the financial year ended 2 July 2023 [Annual report]. ASX Announcements.
- 2. Lovisa Holdings Limited. (2025). Preliminary final report for the financial year ended 29 June 2025 [Annual report]. ASX Announcements.
- 3. Lovisa Holdings Limited. (2026a, February 18). FY26 half year results [Investor presentation]. ASX Announcements.
- 4. Lovisa Holdings Limited. (2026b, February 18). Half year 2026 results announcement: Strong sales and profit growth continues [Press release]. ASX Announcements.
- 5. Lovisa Holdings Limited. (2026c, February 18). Interim financial report for the 26 weeks ended 28 December 2025 [Interim report]. ASX Announcements.
- 6. Market Index. (n.d.). Lovisa Holdings Ltd (ASX:LOV) share price. Retrieved August 17, 2026, from marketindex.com.au/asx/lov
- 7. MarketScreener. (2026). Lovisa Holdings says billionaire Brett Blundy boosts stake. Retrieved August 17, 2026.
- 8. StockAnalysis.com. (n.d.). Lovisa Holdings (ASX: LOV) statistics & valuation metrics. Retrieved August 16, 2026, from stockanalysis.com/quote/asx/LOV/statistics/
- 9. Trading Economics. (n.d.). Australia 10-year government bond yield. Retrieved August 16, 2026, from tradingeconomics.com/australia/government-bond-yield
- 10. Yahoo Finance. (n.d.). Lovisa Holdings Limited (ASX:LOV) insiders have significant skin in the game with 41% ownership. Retrieved August 17, 2026.
Views expressed are for learning and discussion. They are not investment advice.
Add a Thought
Something I got wrong, could have done better, or a view I haven’t considered? I’d like to hear it, and every note gets read.